
Spectrograms in R - a gallery
Published:
Creating a spectrogram is a basic step in almost any analysis of audio signals — it shows how the frequencies in a sound change over time. Happily, R has a good few packages for the job, and here I’ll run through the ones I like to use. This post isn’t an introduction to spectrograms themselves; if you want the theory, try other resources, such as these lecture notes from UCL.
The examples below come mostly from the official documentation and are kept as simple as possible. Most of the functions let you customise the plots further.
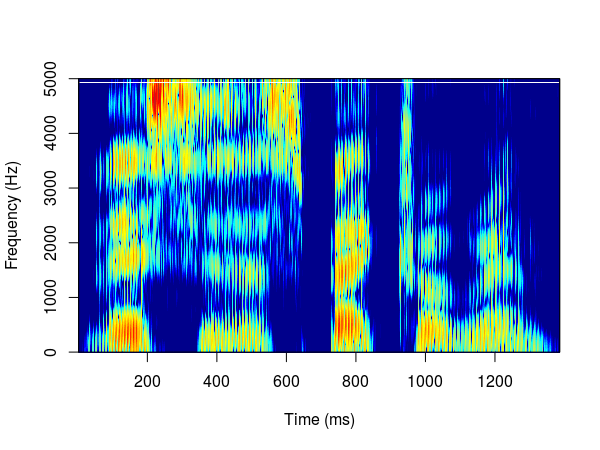
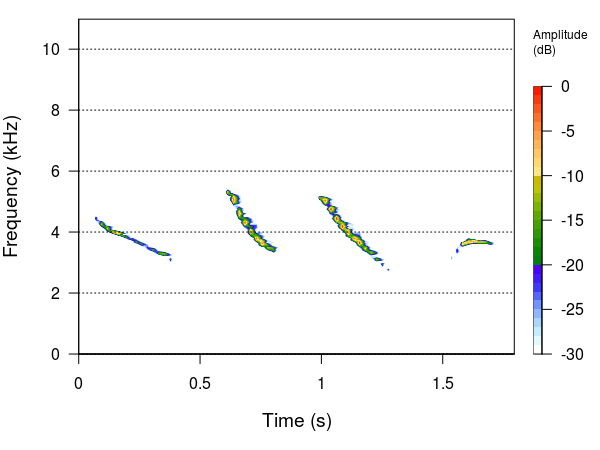
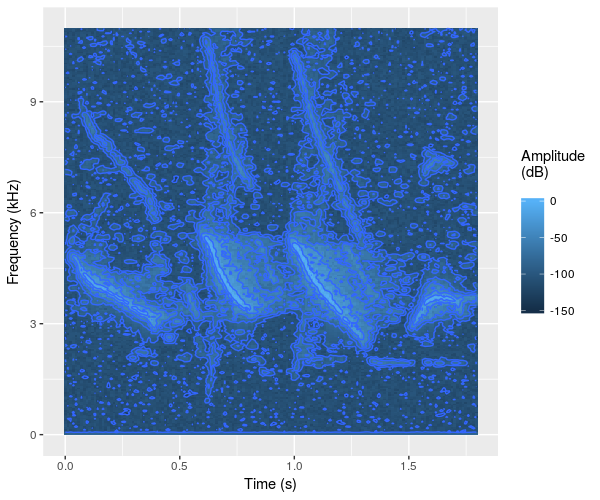
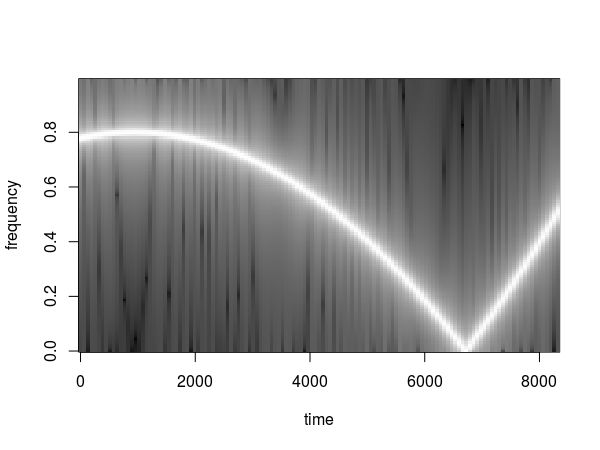
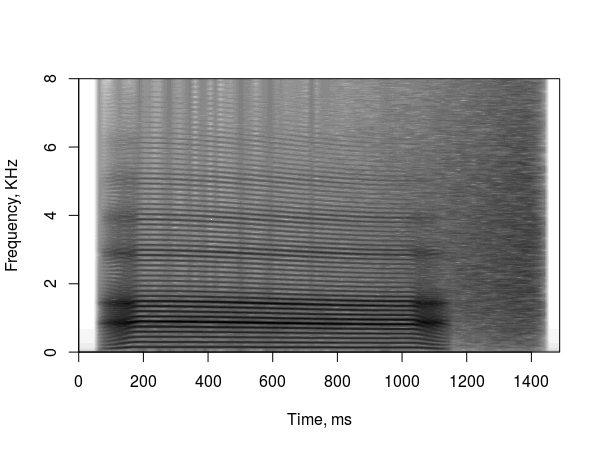
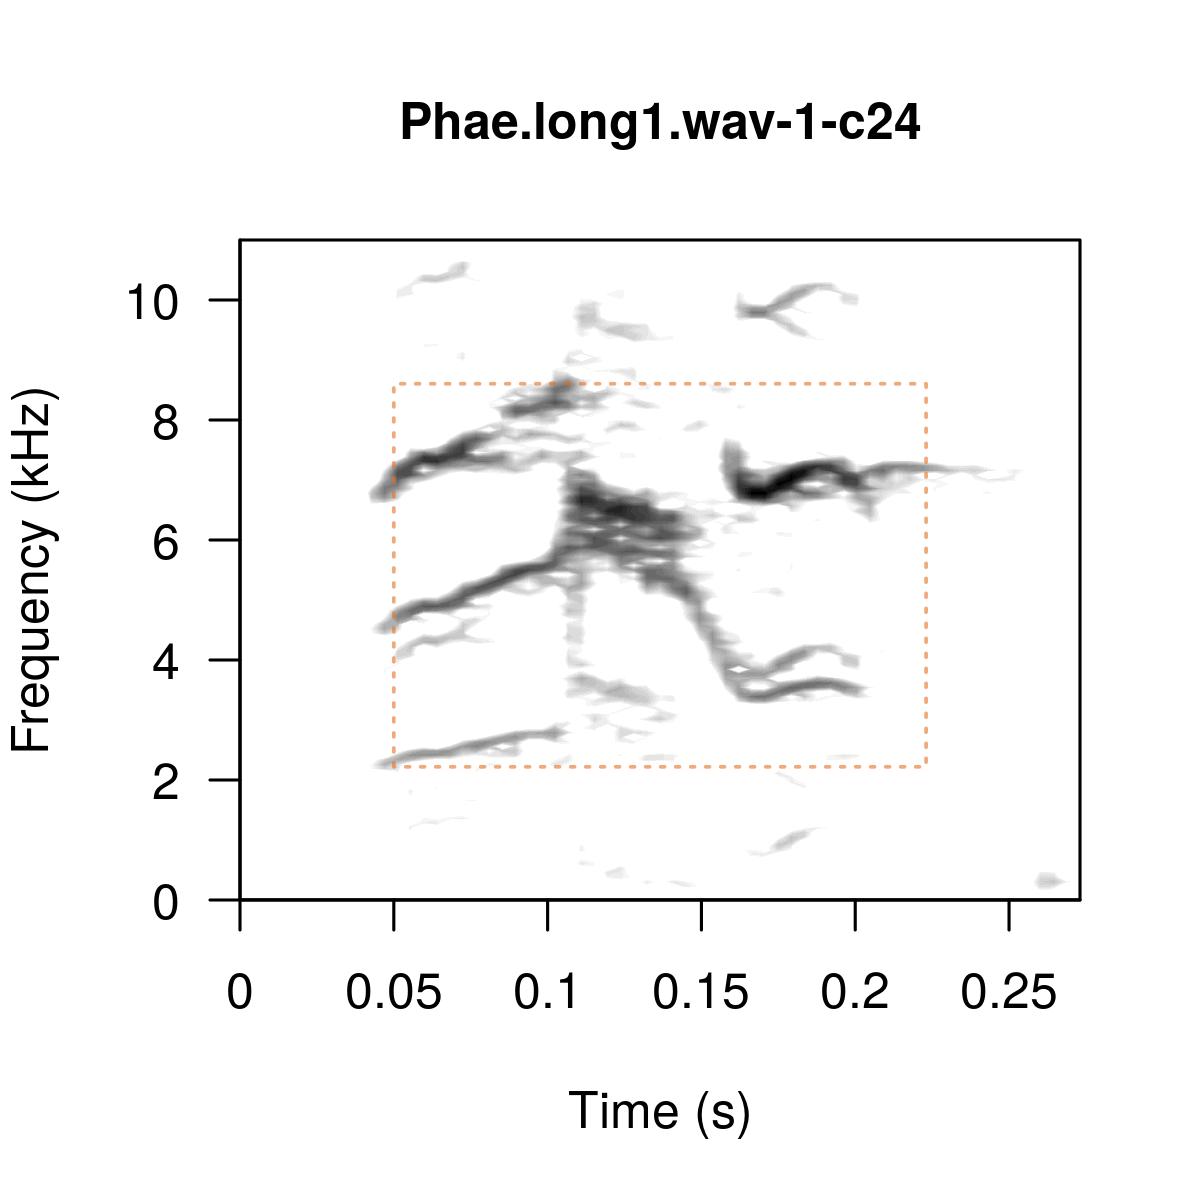
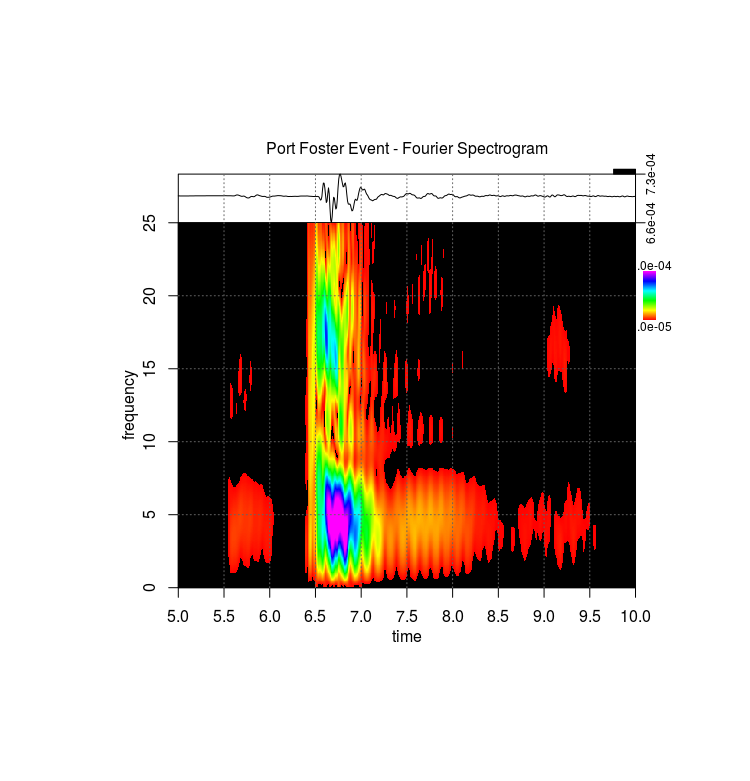
Creating a spectrogram from the scratch is not so difficult, as shown by Hansen Johnson in this blog post. Another solution was provided by Aaron Albin. 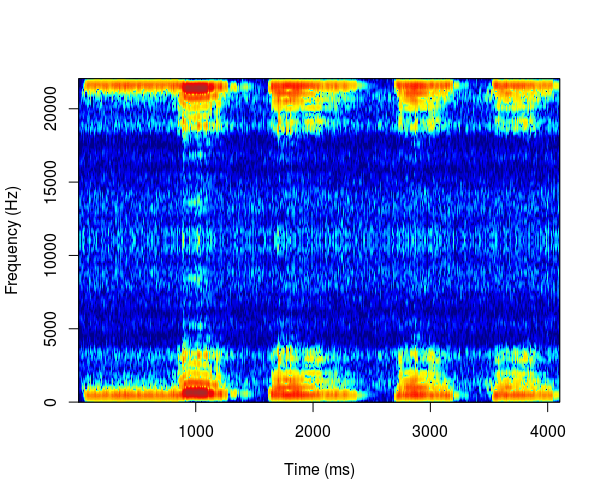
Praat is a workhorse of audio analysis. It is a standalone software, but there is also an R controller called PraatR, that allows calling Praat functions from R. It is not the easiest tool to use so I will just mention it here for reference.
I am pretty sure that there are more packages that allow creating spectrograms but I had to stop somewhere. Feel free to leave comments about other examples.