
Polling data for 2015 Polish parliamentary election
Published:
I’m back to analysing political data, having found a nicely formatted dataset on one of my favourite blogs. The post that got me started asked whether you can predict election results from polls and online popularity data. The short answer: not yet. But as more people turn to digital media and opinion polls, those channels are likely to shape future campaigns.
I didn’t touch the actual results here — I only used the variables that came with the compiled dataset: Google Trends popularity, social media popularity, and opinion polls. There’s more detail on the data here (in Polish).
After loading the data, I used the missmap function to look at the missing values. There are quite a few gaps in the polls, social media, and Google Trends data (in that order). 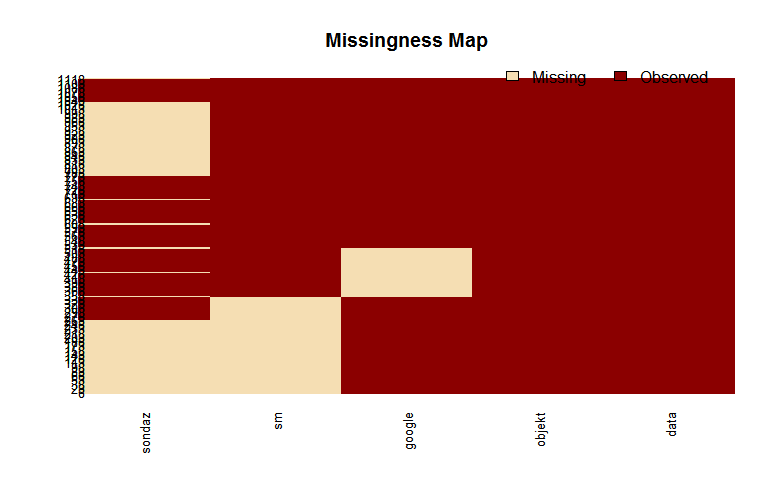 To get an overview I used tableplot from the tabplot package.
 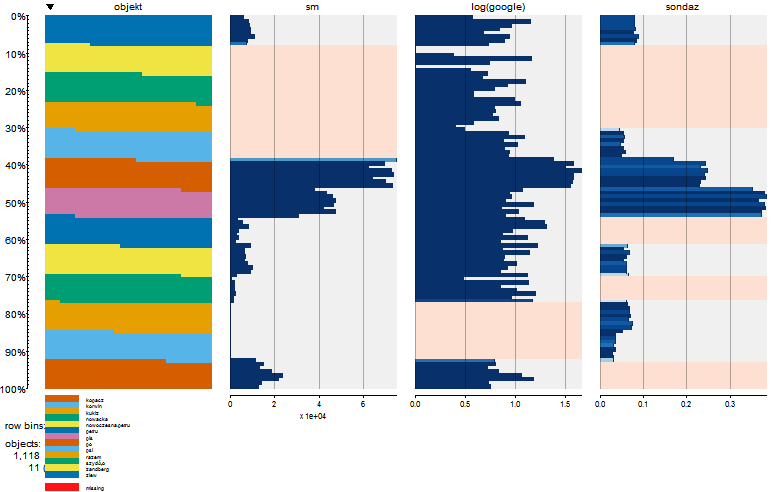 The next step was plotting time series of the individual variables.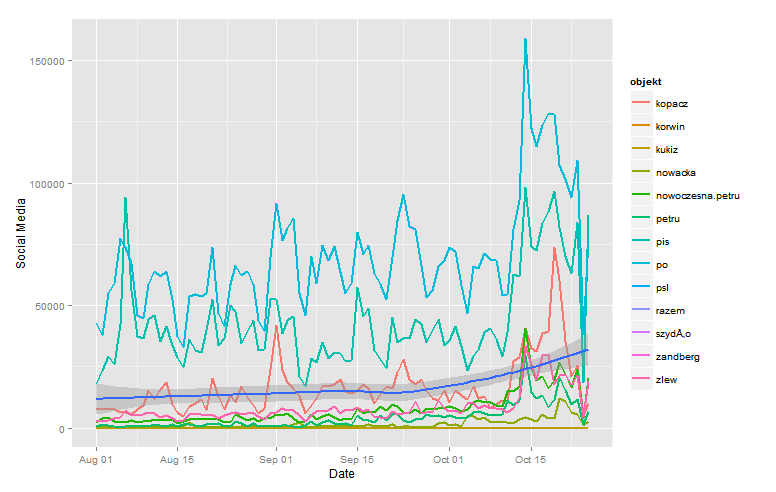
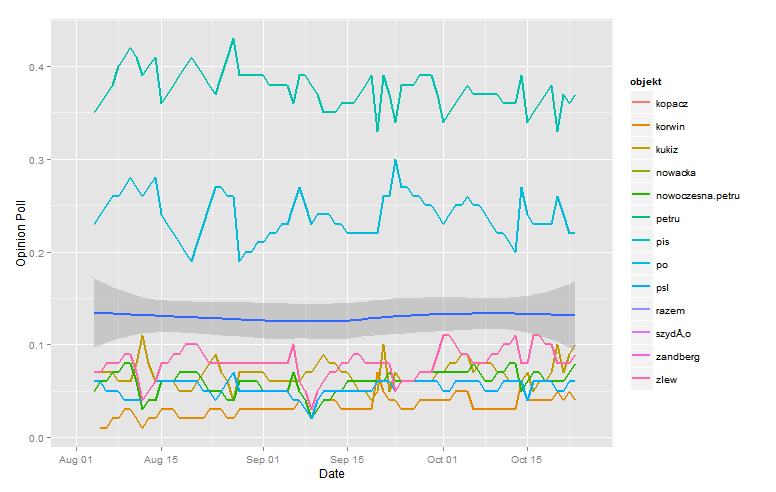
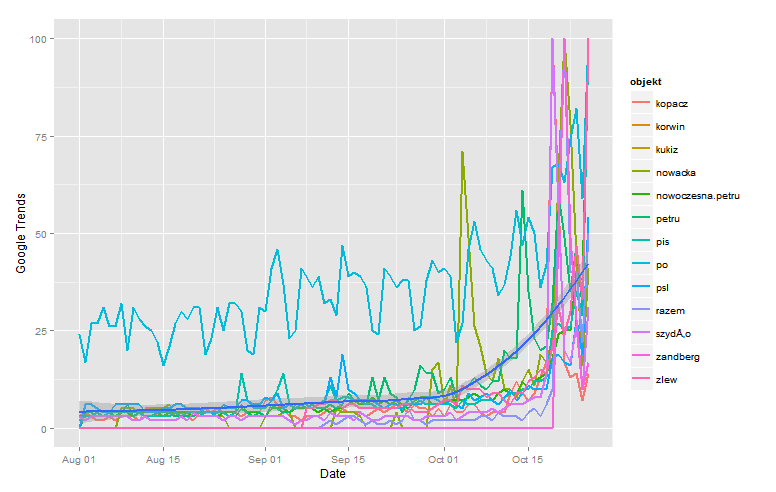 The plots above show overall social media and Google Trends activity (dark blue line) picking up as election day approached, while the averaged poll rating across all parties (dark blue line) stayed fairly flat. That’s not the most exciting finding, so splitting the values by party or candidate would be the sensible next step.
I ran an autocorrelation on the cleaned data frame (with NAs removed) to see how each variable correlates with itself over time. 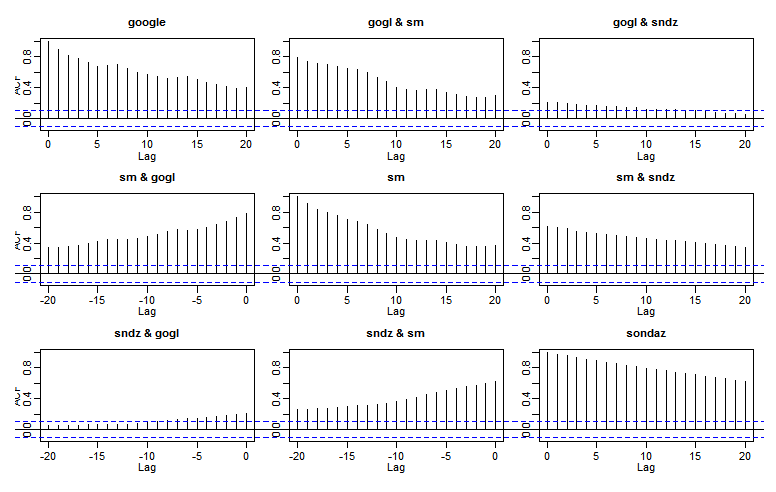
And here’s the code: