
Loading and plotting nirs data in R
Published:
I’ve recently been learning to use the Hitachi ETG-4000 for functional near-infrared spectroscopy (fNIRS) in my research. I quickly discovered that, as so often in neuroscience, the main analysis packages are written in MATLAB. 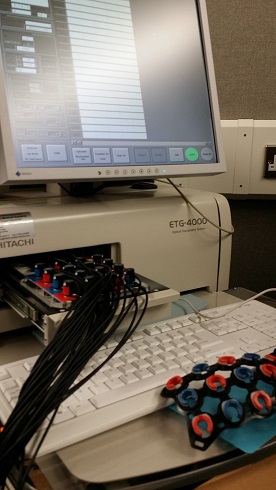 I couldn’t find any R code for analysing fNIRS data, so I decided to write my own. There are apparently some Python options, like MNE and NinPy, which I’ll look into another time.
The ETG-4000 records data in fairly straightforward .csv files, but the most popular MATLAB package for fNIRS analysis (HOMER2) expects .nirs files.
There’s a ready-made script that converts Hitachi data into the .nirs format, but it too is MATLAB-only. I’ll skip the conversion step for now and work with a .nirs file directly.
The file I used (Simple_Probe.nirs) comes from the HOMER2 package. It is freely available in the package, but I uploaded it here to make the analysis easier to reproduce.
My code is here: This produces a separate time series plot for each channel, with the triggers overlaid, like this: 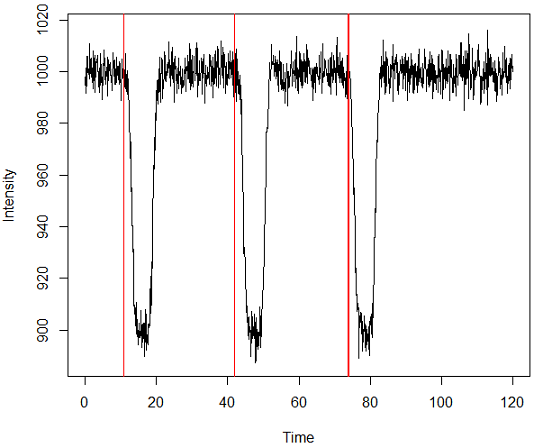
The entire analysis workflow:
Other files:
I hope this helps. More to follow.