
Interactive radar chart in R - Another EDA
Published:
Kaggle released a new dataset that looked perfect for trying out the interactive visualisations from the qtlcharts, ggvis, and radarchart packages.
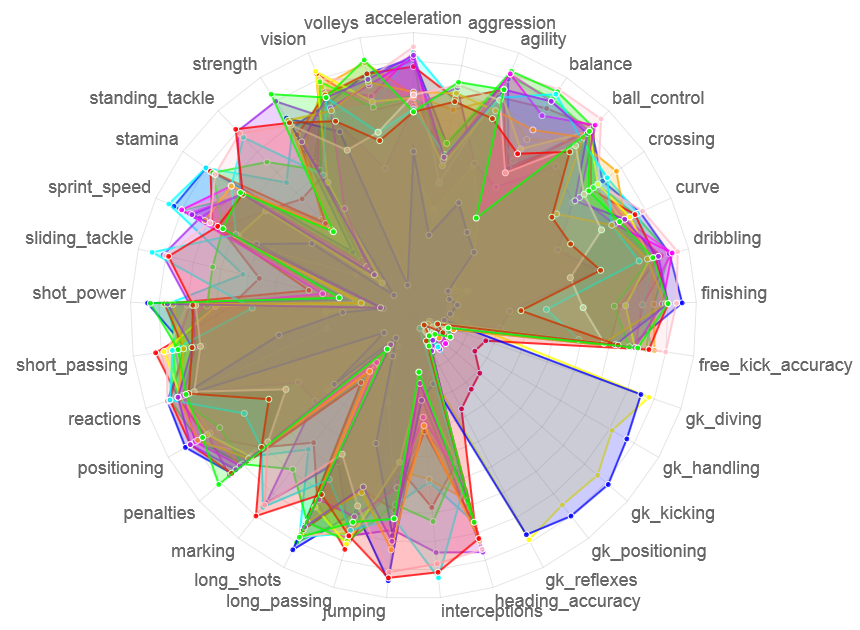
The HTML report was generated with R Markdown, and the latest version uploaded to Kaggle (as a kernel) is here.