
Foreign crime victims in Poland
Published:
I recently read an article (in Polish) about the Polish police massaging their statistics. It made me wonder what data they publish on their website, and whether any interesting patterns might turn up.
The site does offer some data, but it’s badly formatted, none too recent, and only available as a PDF.
I didn’t fancy scraping the page, so I copied and pasted the data by hand and did some initial cleaning in Excel, pulling out the numbers that followed each backslash.
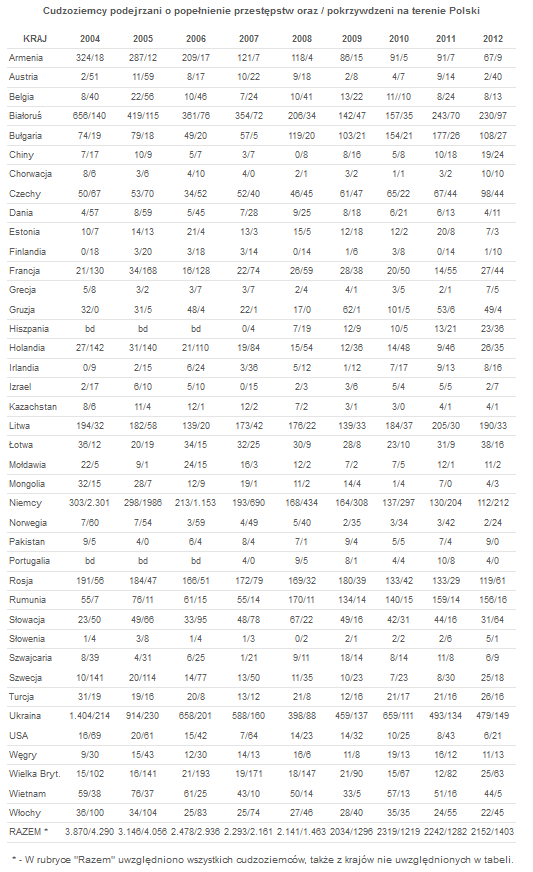
I decided to focus on the ‘Foreign - Crime’ dataset. Surprisingly, both perpetrators and victims are lumped together in a single table, separated by a backslash. As if that wasn’t messy enough, someone had split the table in two, each half with a different number of rows and some missing values (marked ‘bd’). Victims and suspects from countries not listed individually were rolled into the totals (in Polish, ‘RAZEM’), which I left out of my analyses.
The original(-ish) data came in wide format, but I needed it in long format, so I reshaped it with tidyr: Then I built a heatmap with ggplot2 and RColorBrewer: Here’s the result:
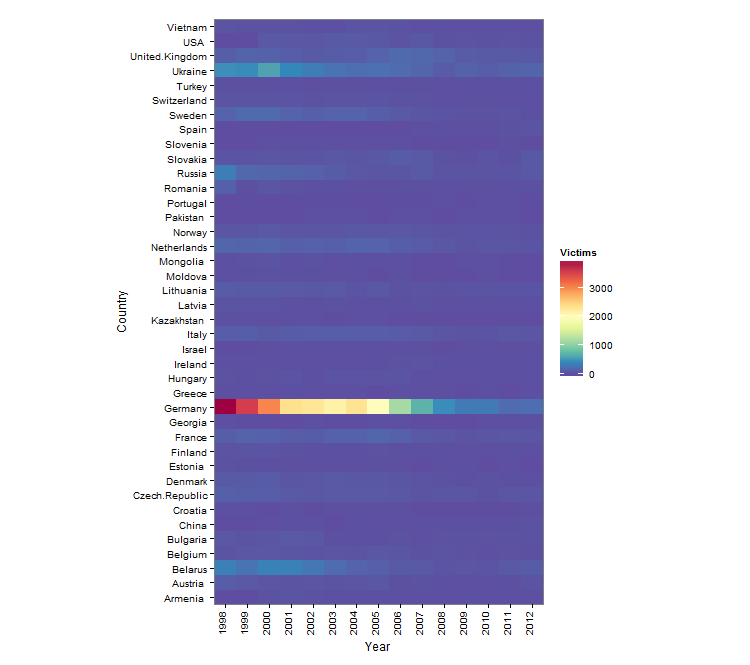
In raw numbers registered by the police, it’s now fairly clear which countries’ citizens were the most common crime victims in Poland. The dataset says nothing about how many visitors came from each country, though, so it can’t really tell us how likely a foreigner is to become a victim of crime in Poland.
I wanted a bit of interactivity and didn’t have much time, so I put together a dashboard in Tableau:
It’s a much quicker way to make static or interactive plots, though the results are harder to reproduce than they would be in R.