Plot the raw signal
Plot the raw signal
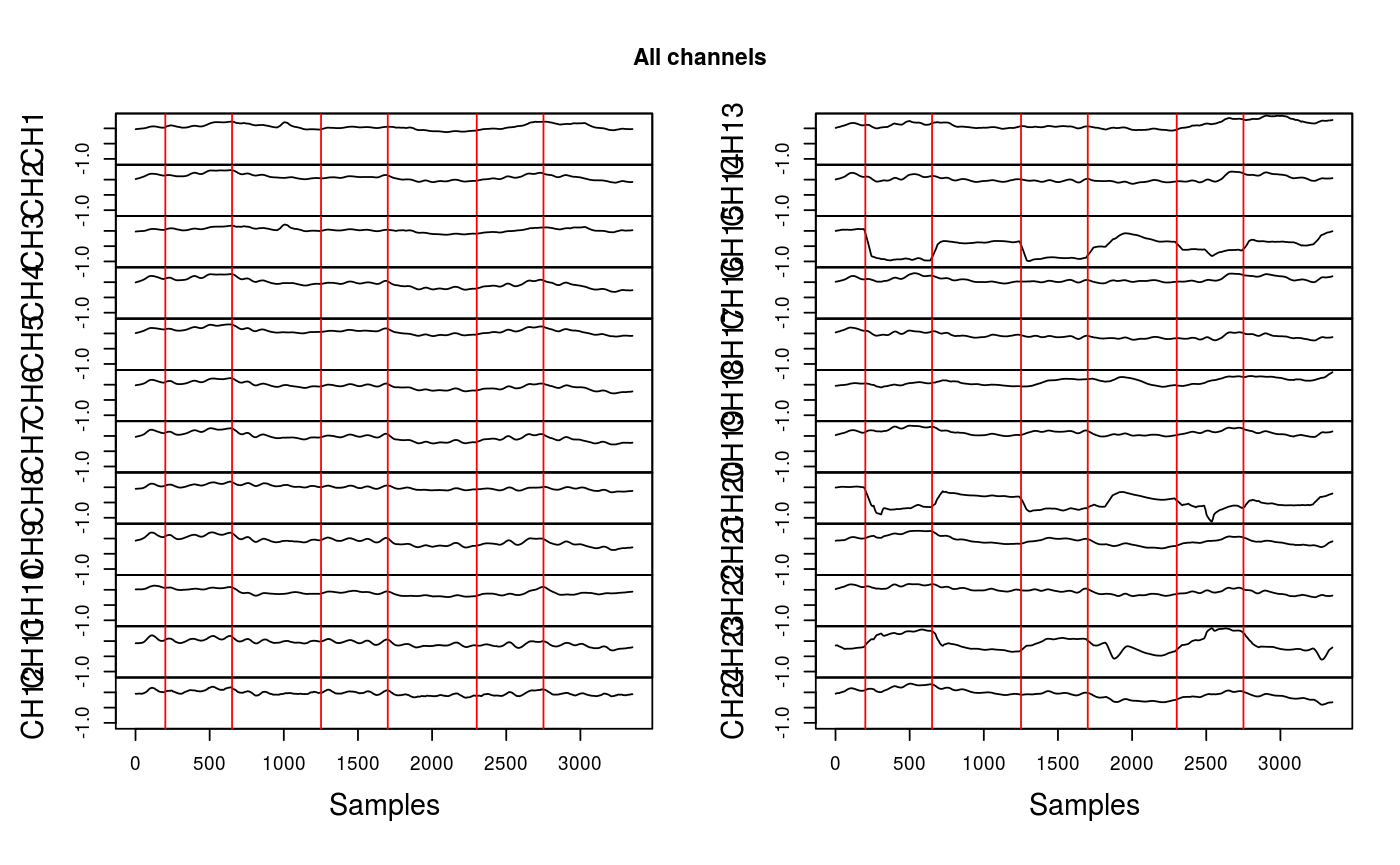
plot_ETG4000(x, type = "facets", channel = NULL)
Arguments
| x | A data frame with an ETG-4000 data. |
|---|---|
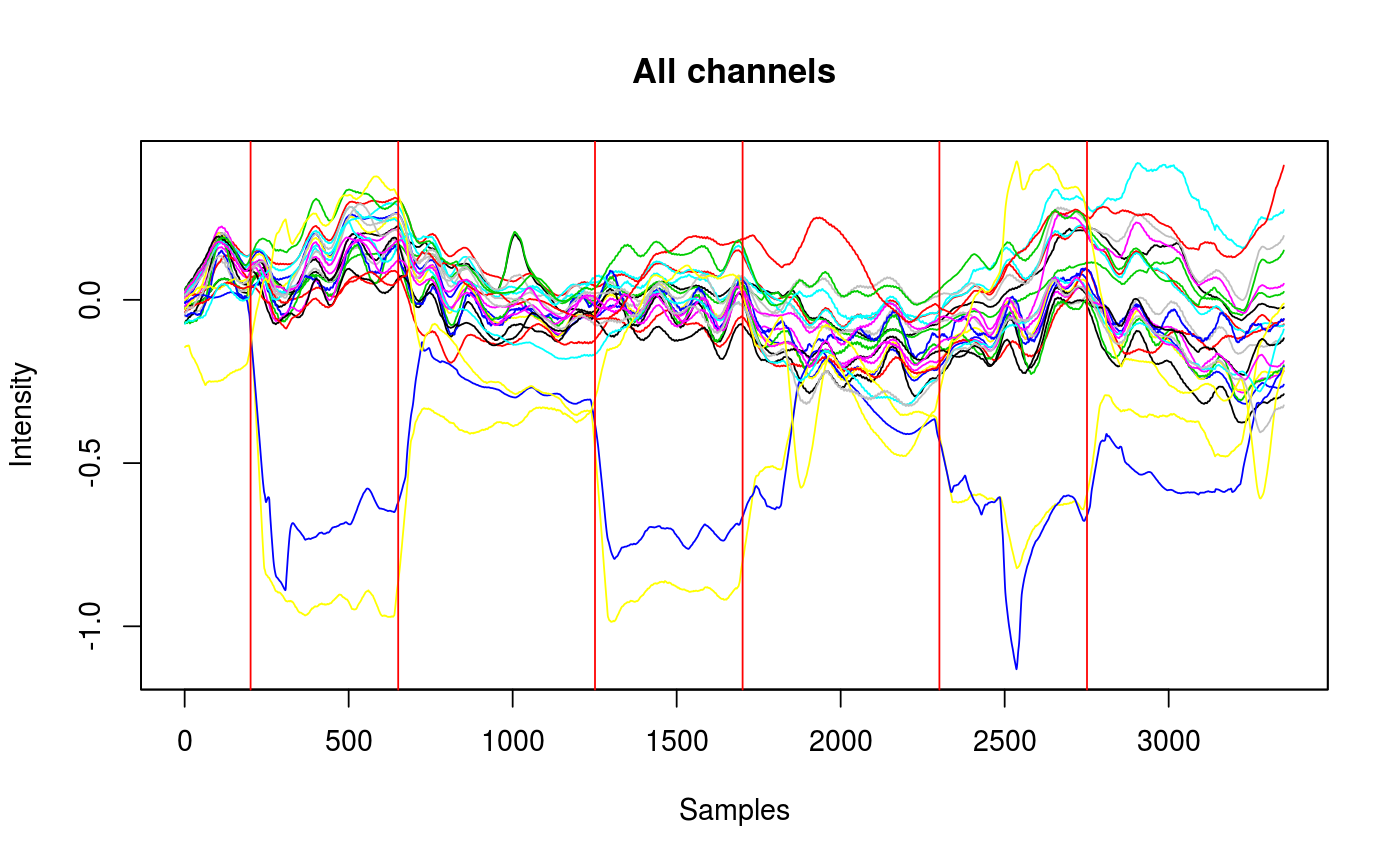
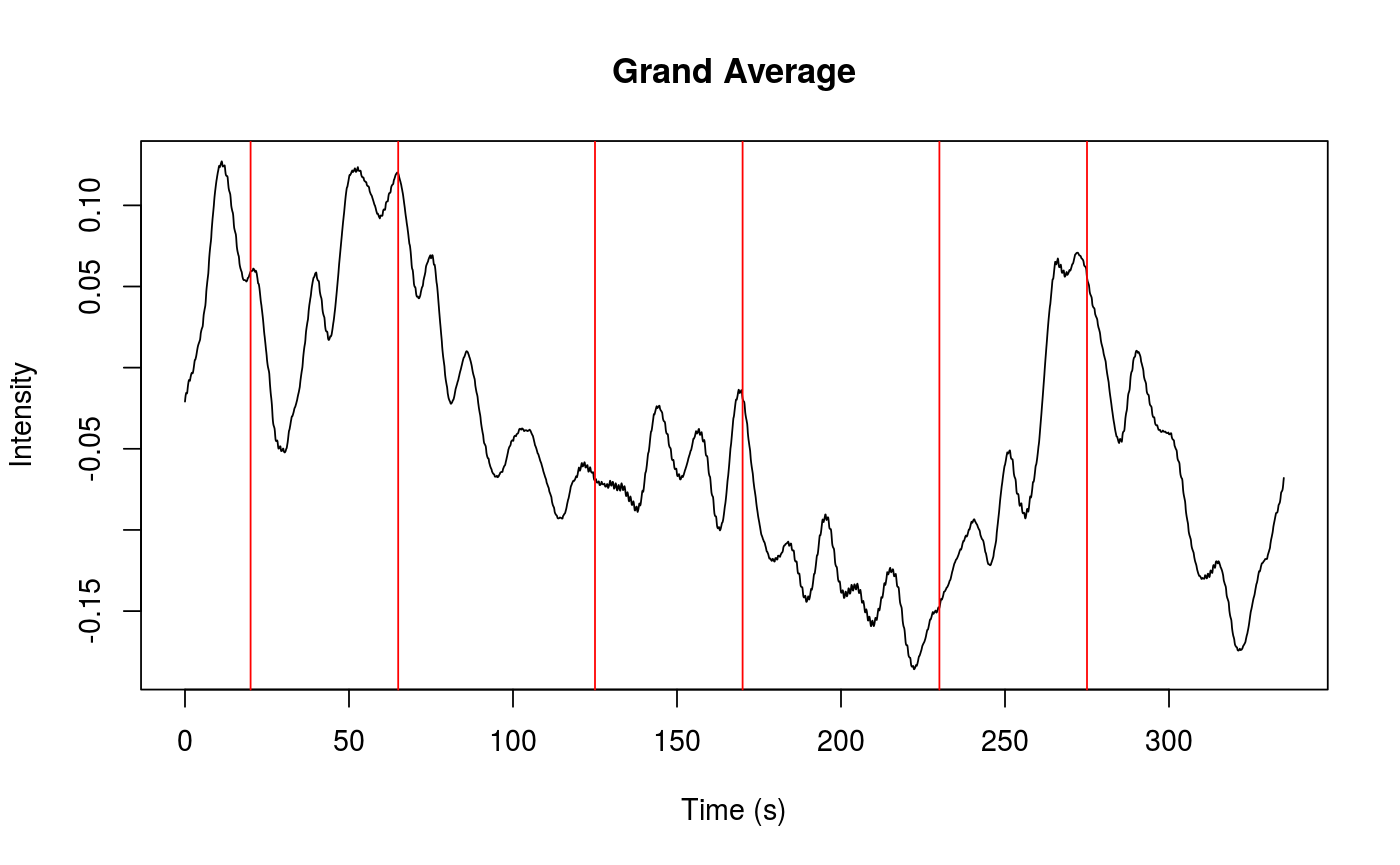
| type | A string. Specifies the type of plot. Options: "facets", "overlap", "separate", "average". Defaults to "facets". |
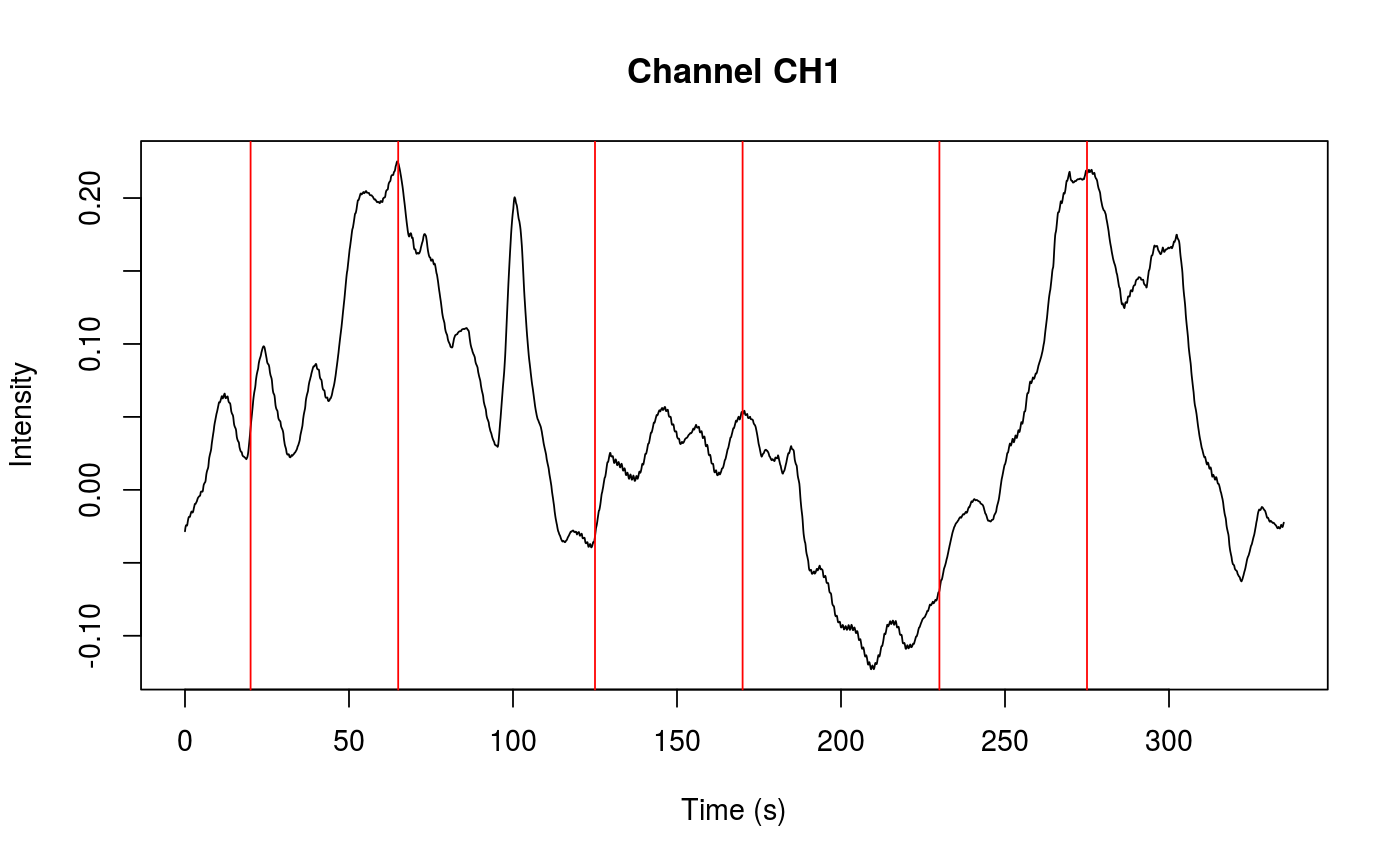
| channel | An integer. Represents the channel number. |
Value
A plot.
Examples
file_path <- system.file("extdata", "Hitachi_ETG4000_24Ch_Total.csv", package = "fnirsr") ETG_header <- load_ETG4000_header(file_path) rawData <- load_ETG4000_data(file_path, ETG_header) plot_ETG4000(rawData)plot_ETG4000(rawData, type = "overlap")plot_ETG4000(rawData, type = "separate", channel = 1)